By SALINA POST
Salina was warmer and had near normal precipitation in October.
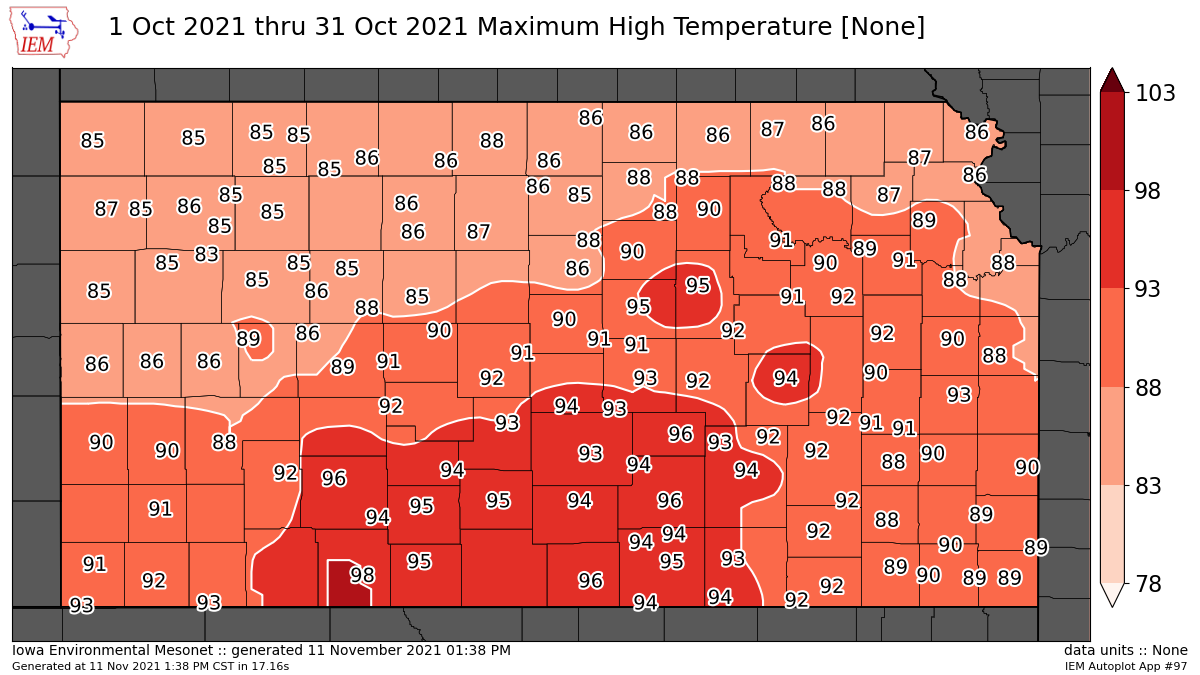
According to Salina weather stats from the National Weather Service, the average monthly temperature of 60.5 degrees was 3.5 degrees warmer than normal. It tied for the 25th warmest October in Salina since records began in 1900, and was the warmest since 2016.
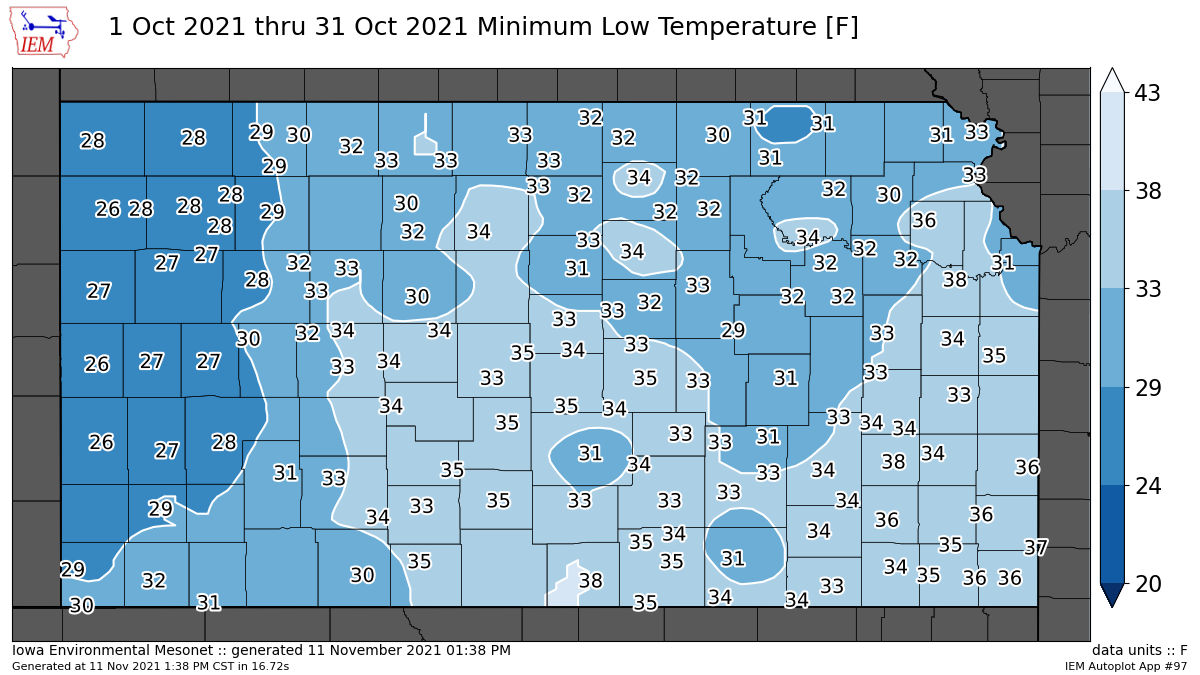
The highest temperature for the month was a scorching 95 degrees on Oct. 9, coming in just under the all-time high October temperature of 100 degrees on Oct. 3, 1954. Salina's October 2021 low temperature was 32 degrees on Oct. 16 and 30. The all-time October record low temperature was 13 degrees on Oct. 31, 2019.
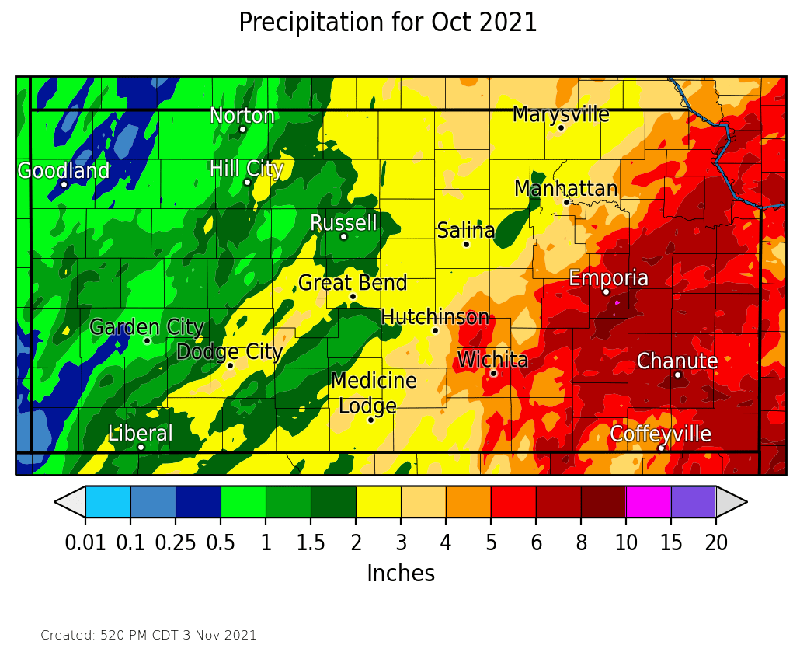
Precipitation-wise, 2.10 inches was measured in October 2021, which was only 0.06 of an inch drier than normal, the weather service noted. It was the wettest October since 2018. The all-time wettest October in Salina was in 1941, when 7.36 inches of precipitation was recorded. The least amount of October precipitation was in 1952, when no precipitation was recorded.
The average wind speed in Salina this past October was 9.8 mph. The highest wind speed was 45 mph and the highest wind gust was 65 mph. Both were recorded on Oct. 28.